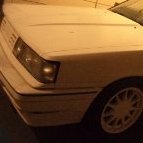
Jump to content
SAU Community

Recommended Posts

hi guys,

have near new headlights for r33 skyline s1 (they r from 4 door skyline but fit 2 door as well) only difference is that 4 door h.lights have chrome reflectirs not black like 2 door (chrome is better looking anyway)

as i said they r in very, very good condition

called nissan for brand new price, just under $1200 for a pair of s1 headlights

CHEERS

Link to comment
https://www.sau.com.au/forums/topic/30493-fs-near-new-r33-headlights/
Share on other sites

some idiot delivery guy left the goods in front of d door without getting money first and i had to chase my money for weeks... got it at d end

h.lights had for 3 years now siting in my garage in d box as my mate got them for me at the same time as me (other pair) for my skyline (after little accident)... i just kept them in case i need them one day... dont need them now... sold my r33

cheers

Ok, so they difinately fit 2door series one R33 gtst ?

Im talking about COD to a post office.. you know, they dont give you package untill you pay..

the most i can afford at the moment it $400, maybe $450 in a few days. Had a gutter accident recently and cracked one of the headlight brakets.. can get it fixed or buy new ones..

Create an account or sign in to comment

You need to be a member in order to leave a comment

Create an account

Sign up for a new account in our community. It's easy!

Register a new account

Sign in

Already have an account? Sign in here.

Sign In Now


  • Similar Content

  • Latest Posts

    • Yeah, that's fine**. But the numbers you came up with are just wrong. Try it for yourself. Put in any voltage from the possible range and see what result you get. You get nonsense. ** When I say "fine", I mean, it's still shit. The very simple linear formula (slope & intercept) is shit for a sensor with a non-linear response. This is the curve, from your data above. Look at the CURVE! It's only really linear between about 30 and 90 °C. And if you used only that range to define a curve, it would be great. But you would go more and more wrong as you went to higher temps. And that is why the slope & intercept found when you use 50 and 150 as the end points is so bad halfway between those points. The real curve is a long way below the linear curve which just zips straight between the end points, like this one. You could probably use the same slope and a lower intercept, to move that straight line down, and spread the error out. But you would 5-10°C off in a lot of places. You'd need to say what temperature range you really wanted to be most right - say, 100 to 130, and plop the line closest to teh real curve in that region, which would make it quite wrong down at the lower temperatures. Let me just say that HPTuners are not being realistic in only allowing for a simple linear curve. 
    • I feel I should re-iterate. The above picture is the only option available in the software and the blurb from HP Tuners I quoted earlier is the only way to add data to it and that's the description they offer as to how to figure it out. The only fields available is the blank box after (Input/ ) and the box right before = Output. Those are the only numbers that can be entered.
    • No, your formula is arse backwards. Mine is totally different to yours, and is the one I said was bang on at 50 and 150. I'll put your data into Excel (actually it already is, chart it and fit a linear fit to it, aiming to make it evenly wrong across the whole span. But not now. Other things to do first.
    • God damnit. The only option I actually have in the software is the one that is screenshotted. I am glad that I at least got it right... for those two points. Would it actually change anything if I chose/used 80C and 120C as the two points instead? My brain wants to imagine the formula put into HPtuners would be the same equation, otherwise none of this makes sense to me, unless: 1) The formula you put into VCM Scanner/HPTuners is always linear 2) The two points/input pairs are only arbitrary to choose (as the documentation implies) IF the actual scaling of the sensor is linear. then 3) If the scaling is not linear, the two points you choose matter a great deal, because the formula will draw a line between those two points only.
    • Nah, that is hella wrong. If I do a simple linear between 150°C (0.407v) and 50°C (2.98v) I get the formula Temperature = -38.8651*voltage + 165.8181 It is perfectly correct at 50 and 150, but it is as much as 20° out in the region of 110°C, because the actual data is significantly non-linear there. It is no more than 4° out down at the lowest temperatures, but is is seriously shit almost everywhere. I cannot believe that the instruction is to do a 2 point linear fit. I would say the method I used previously would have to be better.
×
×
  • Create New...