
Wrecking R33 Series 2 1998 Melb 80k Km White

Announcements
-
Similar Content
-
-
Latest Posts
-
 I ordered it this morning, I'll disassemble it post pic's and info following delivery.
 -

-
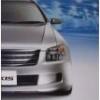 Yes, the Axis, Axis S and 350S models all had a huge chrome grill. All others from factory has the Nissan emblem with thick chrome horizontal bars.
 -
No Stagea had the CVT. That was reserved for the V35. M35 Stageas had the RE5 and RE4 auto boxes.
-
G35 is the same. RH front : https://www.amayama.com/en/part/nissan/41001al501 LH front : https://www.amayama.com/en/part/nissan/41011al501
-


Recommended Posts
Create an account or sign in to comment
You need to be a member in order to leave a comment
Create an account
Sign up for a new account in our community. It's easy!
Register a new accountSign in
Already have an account? Sign in here.
Sign In Now