
Removing A Stage 2 Shift Kit
Announcements
-
Similar Content
-
-
Latest Posts
-
 Thanks for sharing that mate, I've got a couple of spares on the shelf but all the unis are tight....will give old mate a shout. BTW are you sure it wasn't just a $400 paint job? Any detail of what they replaced (cut/reweld?)
 -
Yeah I saw that about the US Q50 recently, apparently it was shown to Inifiniti dealers (probably to help with their depression about the cars they can sell). Seemed like a really obvious step to me, the platforms are very similar in many ways. Even if there aren't many people who actually put the money up it should really help with image/reputation. What hasn't been clear anywhere if that is a V38 model of if they are just going to add the trans as an option in a new model year. What they did with the Z from 370z to "Z" is just weird so I'd be surprised if they released this as a V38. Great news for me to have an option; it is far from confirmed that I can get any decent track sessions through the auto so having a manual I can swap to is great.
-
 I ordered it this morning, I'll disassemble it post pic's and info following delivery.
 -

-
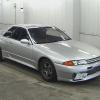
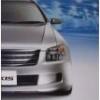 Yes, the Axis, Axis S and 350S models all had a huge chrome grill. All others from factory has the Nissan emblem with thick chrome horizontal bars.
-


Recommended Posts
Create an account or sign in to comment
You need to be a member in order to leave a comment
Create an account
Sign up for a new account in our community. It's easy!
Register a new accountSign in
Already have an account? Sign in here.
Sign In Now