

Announcements
-
Similar Content
-
-
Latest Posts
-

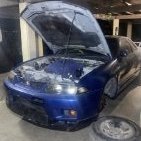
By TurboTapin · Posted
I wasn't aware the GKTech bushings changed the placement of the subframe. What improvements did you see? -
 I did that today. I couldn't get the scope in there but I could get a good look with a torch. There was heaps of shit on the walls of the sensor hole that I cleaned as best I could but I couldn't see any damage or anything untoward. 😞
 -
 Jack the back of the car up, pull that wheel off, pull that sensor out, and put a bore scope into the hole to inspect the outer casing, see if anything looks damaged before you pull the whole thing apart.
 -
Ergh... So I pulled the speed sensor out again and the tip was shiny so I think it's rubbing the bearing. The bearing contains the magnets for the speed sensor so I think when the first sensor broke it damaged the magnet ring on the bearing. This is just a Google image, but there is a hole going to the bearing. So when the tip broke off the old sensor I'm guessing it fouled the bearing... As the magnet is only protected by a plastic cover it would be easy to damage it. So I guess I'm doing a bearing again.
-
 My thinking is that if the O2 sensor is shot then your entire above described experience is pure placebo.
-


Recommended Posts