

Announcements
-
Similar Content
-
-
Latest Posts
-

By R34_GT to Turbo · Posted
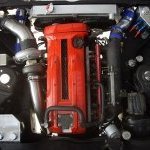
Ok I get you. But isn’t the butterfly intake a headache with the +T? see this is my plan so far but please advise me into the right direction. Nistune Ecu, 1000cc Bosch injectors, TD05 or TD06 Kinugawa turbo using stock rb25det exhuast manifold, walbro fuel pump unsure of model I think it’s 450/460, spitfire coils and sparks to suit and a R35 MAF sensor and boost sensor. I was thinking maybe do a cheap eBay plenum $400-500 or try find a stock det neo intake. I think I’d port match it so it’s getting the full capacity but open to advice please. Thanks -

By GabsReDeal · Posted
The issue now is the 'fuel cut' while driving, and when it happend, it does not stall. This, I did not test the fuel pressure while driving as I cannot with a fuel pressure gauge. I do have Nistune logs, yes. I have also replaced the MAF Sensor. Also related to the FPG Fuel Hanger – I just realized that I need a Deutsch Crimp Tool to crimp some cables for the FPG Fuel Hanger. Need to purchase additional cables as the kit only included 2, which are for the float. FPG has not responded to my emails so far since purchasing. I thought about taking it to someone and having it done professionally, but I am reluctant since everyone I took it to messed up in some way. -

-

By Dose Pipe Sutututu · Posted
The German place in Cabramatta was rock solid, fresh pretzel cooked to order back then. Then it went all quiet, after all the poker machines were removed, then I believe it closed for good. I did drive past the other week and noticed outdoor lighting a big screen, but no idea what is there now. -

By joshuaho96 · Posted
Yeah I suspect even if you hold airmass per cycle/cylinder constant if you get too far away from stock you're still going to have problems running the factory tune within the bounds of the factory load scale. Cams, different displacement/rod ratio, etc. I'm just lucky that the GTIII-SS with wastegate boost + CA compliance cats is pretty much equivalent to stock turbos. When I have actual space I can finally get it tuned and modify the fuel system for flex fuel to 100% handle any detonation concerns when cranking the boost to whatever those dinky turbos can put out.
-


Recommended Posts
Create an account or sign in to comment
You need to be a member in order to leave a comment
Create an account
Sign up for a new account in our community. It's easy!
Register a new accountSign in
Already have an account? Sign in here.
Sign In Now