

Announcements
-
Similar Content
-
-
Latest Posts
-
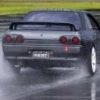
 Also playing with fire if they start to flow more air down low than what the stock twins can. It's not even up top you need to worry, it can be at 3000rpm and part throttle and it's getting way more flow than it should.
 -
-

By joshuaho96 · Posted
You still want a proper tune on the stock ECU though. Stock tune + stock ECU with GT-SS/-9s is probably playing with fire if you're running more than stock airflow/power. -

-
 Definitely a hearty eater when we go out, I consider these meals my cheat day as I've been watching my calories in and calories out pretty hard since my little fun size stroke, I've gone from a fat boy of 89 Kg, I'm only 165cm tall/short, down to a almost semi lean 73 Kg over the last few years, I'm currently around 17% body fat which my doctor is very happy with, but, my goal is to slowly get down to and maintain 15%,so yeah, I want all of the protein, carbs, fats and sugars when I go out for a binge
-


Recommended Posts