
Fs: 2 X Garrett 2860 -7 Turbos

Announcements
-
Similar Content
-
-
Latest Posts
-
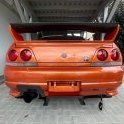
 It’s definitely an import, the Aussie ones have reflectors in the rear bar, it’s also a turbo which none of the Aussie one were. I remember back in the day I want a twin turbo z32 so bad and then I saw a 32 gtr and that was the end of that lol
 -
 Same can be said for Subarus motors ha ha! I like the 300ZX, I nearly bought a Z32 before I bought my first Skyline. It was going to be a project. Then I found out there was a bit of a dodgy title with it... As in, someone attempted to commit insurance fraud with it and there was now some dodgy legalities around it. So at 18 I walked away from it.
 -

By GabsReDeal · Posted
The below is what the readings I had with the fuel pressure gauge which were correct. It seems like the issue is mainly during drive and not idle. I bought the new hanger hoping it could be the issue, perhaps I ruined something while cleaning, but I have not installed it yet since I have to wire up everything with the new plugs. -

By GoHashiriya · Posted
Actually, that's not entirely true. It's also the same motor in the 1st gen Nissan Cube but they're rare as hen's teeth. -
 Yeah it is always worth testing and balancing actuators out of the box, just set the pressure regulator on a compressor very low (eg 5 psi) and increase it slowly to see when they both move.....unfortunately while you may be able to adjust the length of the actuator rod to minimise any difference, the actual pressure they move from is not adjustable so you need a well matched pair. And yes, the VCAM is probably contributing; the earlier in the rev range they come on boost and the slower the revs build (I think your demo was in 5th), the more you notice it. Driving at WOT through 1st, 2nd, 3rd etc you will probably never hear it as any shuffling starts and is over super quickly
-


Recommended Posts
Create an account or sign in to comment
You need to be a member in order to leave a comment
Create an account
Sign up for a new account in our community. It's easy!
Register a new accountSign in
Already have an account? Sign in here.
Sign In Now