

Announcements
-
Similar Content
-
-
Latest Posts
-

By joshuaho96 · Posted
If there's no stutter in fuel pressure when the issue occurs then I'm not sure it's the fuel system necessarily. Do you have any Nistune logs when the issue occurs? -

-

By Dose Pipe Sutututu · Posted
you would be better off installing a Haltech (or similar) with a wideband O2, run the base map with O2 feedback on at gate pressure. -
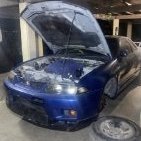 Thank you for the feedback bro. Looks like it’ll have to stay off the road till it gets an ecu
 -
 Only if you do not You will not be able to drive it with any serious load without risk of it pinging, which will either slowly or rapidly kill it, depending on how bad it is.
-


Recommended Posts
Create an account or sign in to comment
You need to be a member in order to leave a comment
Create an account
Sign up for a new account in our community. It's easy!
Register a new accountSign in
Already have an account? Sign in here.
Sign In Now