
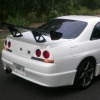
photos of some skylines there the best

Announcements
-
Similar Content
-
-
Latest Posts
-
 What an awesome idea to fit the facelift Lamborghini Diablo headlights. They are a perfect fit!
 -

By hoodedreeper · Posted
An update regarding the registration with the DVLA I sent off the paperwork the day after I collected the car from the port, two weeks later it was all returned with a letter explaining they have rejected the application. This was because the cheque was £20 short for the road tax (I used a price list I found online). Nevermind it is what it is, it was sent back to them the following day with a new cheque. Fast forward another 2 weeks or so, I called them for an update to be told it had been rejected. Yesterday (16th September) I received the documents back along with another letter, this time it was because I didn't put an X in one box on the V750 (personalised number plate certificate), which declared that I had the rights to the personalised number plate. Why this wasn't mentioned in the first rejection letter, I don't know, but it could have saved this headache. The documents were sent back today, so fingers crossed third times a charm and it'll FINALLY be registered on the road just in time for the bad weather (woohoo!) To cheer myself up I lowered the front 25mm, was sick of seeing it sit like a monster truck. No idea how much clearance I'll have getting on and off the driveway, I'll worry about that when I can actually drive it -

By Dose Pipe Sutututu · Posted
You're going to miss not worrying about rust in the strut towers like the Skyline shitboxes out there -
By hoodedreeper · Posted
A few little updates that weren't filmed due to not taking long to do or not interesting enough for their own video. My new K&N Air Filter arrived, I went with an RU-4180 which matched the dimensions of the universal cone filter the car originally had. The battery had gone flat, while that was charging I tidied up the spaghetti wiring at the bulk head and down the sides of the engine Next job was to swap the stereo The Kenwood harness had the female ISO plugs cut off and the male ISO plugs cut off the adaptor loom and joined with bullet connectors. I ordered in a repair loom through work and re-did it all. New Kenwood unit installed (Android Auto, DAB, Bluetooth, Reverse Camera) The bonnet/hood gas struts have been poor since collecting the car. I couldn't find any suitable replacements locally so took a chance on a pair from AliExpress. The originals don't use a retaining clip to secure the cup onto the ball fixture, would explain why I struggled for 10-15mins trying to pry off the cups. The ball fixtures unscrew using a 12mm spanner, new ones are the same size. Sadly no photo of them fitted, you're not missing much lol The dished Momo steering wheel got replaced with my Momo Tuner, turns out I ordered counter sunk bolts for the horn trim ring (like they normally are for the steering wheel) instead of allen cap (flat seat) A terrible photo of a Quaife style gear shift knob I've had stashed in my tool box for many years after purchasing the incorrect thread size (I can see a pattern emerging with ordering incorrect parts...) Also threw in a cup holder and a (empty) Boss Coffee can, because why not -
 GT-R clearly the better choice! The 300 is certainly not insaly fast but has a decent amount of poke. Does a nice little drift around the corners with a decent amount of throttle. It's VERY predictable in a slide too. Feels so progressive! People probably presume there's a 25 year old driving it based on my behaviour this week! 🤣
-


Recommended Posts
Create an account or sign in to comment
You need to be a member in order to leave a comment
Create an account
Sign up for a new account in our community. It's easy!
Register a new accountSign in
Already have an account? Sign in here.
Sign In Now