

Announcements
-
Similar Content
-
-
Latest Posts
-
 So I'll put filler past the repair area a bit to make sure I don't miss anything. Then I'll block it until it's almost level, put the guidecoat, then keep blocking until it's gone. Then it's still wavy. In regards to hitting the panel, I saw this video might give more context - Skip to 0:47 he knocks it down. But yeah I'm sanding until the guidecoat is gone then checking because otherwise my filler is still well above the bodyline. Unless what you're saying is I should put guidecoat around it early, surrounding the filler then stip once it's gone?
 -

By GabsReDeal · Posted
I refreshed the OEM injectors with the kit and connected it up. It now ideals okay even with the IACV removed. Driving still has the same cutoff issue like the 550cc injectors so the issue is somewhere else. I bought FPG's Fuel Pump Hanger. I will be installing it next, but it is not as straightforward as I thought it was with my limited wiring knowledge and no instruction on the specific model I purchased (FPG-089). I also got the incorrect billet clamp as I could not find info on the OEM sizing. -
 Stop looking at the garage floor, and turn the radio up a bit louder if there's any strange noises...
 -
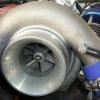
 No. Turbo shuffle and surge/flutter are not the same thing. Specifically, on a GTR, turbo shuffle has a definite meaning. On a GTR, the twin turbos are assumed to be the same thing and to operate the same way, exactly. In reality, they do not. Their exhaust sides are fed and exhaust a little differently, to each other. Their inlet sides are fed and exhausted a little differently, to each other. Consequently, when they are "working" they are often at slightly different points on the compressor map compared to each other. What this means, particularly when coming on boost, is that one of them will spool up and start producing extra flow compared to the other, which will put back pressure on that other compressor, which will push the operating point on that other compressor up (vertically). This will generally result in it bumping up against the surge line on the map, but even if it doesn't, it upsets the compressor and you get this surging shuffle back and forth between them That is "turbo shuffle" on a GTR. It is related to other flutter effects heard on other turbo systems, but it is a particular feature of the somewhat crappy outlet piping arrangement on RB26s. There are plenty of mods that have been attempted with varying levels of success. People have ground out and/or welded more material into the twin turbo pipe to try to prevent it. Extending the divider inside it works, removing material doesn't. There are aftermarket replacement twin turbo pipes available, and these exist pretty mush purely because of this shuffle problem.
 -
 You can temporarily* use lock collars to keep it in place until you can do the bushes, back the nuts off, slide them in, snug back up. *temporarily is often for ever
-


Recommended Posts