

Announcements
-
Similar Content
-
-
Latest Posts
-

-
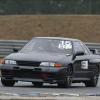 Out with the lenso d1 18x10 +20 with 25mm spacers in with the ame 18x11plus 10 no spacers each rim and tyre was 8 kgs lighter lighter which should be noticeable Apprentice helped out
 -

-

-

By Dose Pipe Sutututu · Posted
Wow... What in the fk, it's a dead head system...
-


1.thumb.png.36afd656b26d55f5d425fc76e21561f2.png)


Recommended Posts