

Announcements
-
Similar Content
-
-
Latest Posts
-
 Thank you for the feedback bro. Looks like it’ll have to stay off the road till it gets an ecu
 -
 Only if you do not You will not be able to drive it with any serious load without risk of it pinging, which will either slowly or rapidly kill it, depending on how bad it is.
 -
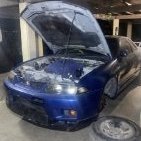
Hi guys, I’m new to the GTR scene. Picked up an R33 GTR earlier this year that needs a lot of love. I’ve been going through the hot side, changing all the gaskets and while it was all off I managed to score a set of -9s. It still had the stock ceramics so I was pretty happy to get the 2860s. I live in a small country in the pacific with 0 performance car scene. No dyno’s no performance parts, let alone stock parts for a skyline. I order everything from Australia and do it myself. This means I’ll be running the stock ECU. Maybe down the track I’ll get an aftermarket set up and do a remote tune. Will the car run -9s on stock tune safely? I have a very heavy foot so I really hope so 😂 thanks guys
-
 perfect, no rush to address the leaking bush then, it's not doing much/anything
 -
I'm not sure if it will bolt up, but.... I'm reasonably sure that the ID of the runners is somewhat smaller on the NAs. So it probably wouldn't be a good match at the flange where the top and bottom meet. So that would be a reason to not do it. And the skinny runners would be the bit you're keeping, which would be a reason to no do it. You'd want the big runners if you were doing any work to swap stuff. Why not just use what you've got, like nearly everyone else who has +T'd an NA? You don't need or want the TCS throttle or other stuff that is specifically DET inlet/crossover.
-


Recommended Posts
Create an account or sign in to comment
You need to be a member in order to leave a comment
Create an account
Sign up for a new account in our community. It's easy!
Register a new accountSign in
Already have an account? Sign in here.
Sign In Now