

Announcements
-
Similar Content
-
-
Latest Posts
-
 GT-R clearly the better choice! The 300 is certainly not insaly fast but has a decent amount of poke. Does a nice little drift around the corners with a decent amount of throttle. It's VERY predictable in a slide too. Feels so progressive! People probably presume there's a 25 year old driving it based on my behaviour this week! 🤣
 -
Yeah Jap import. Fairlady Z then! I'm a bit the same. They've been on my radar for a fair while but then just impulsively decided to buy one! Was going to just buy an NA and add turbos to it later but decided to save the f'ing around and just buy the turbo version.
-
Thanks mate, well done to you too! Yeah not looking forward to doing any major work to it!
-
 No, so what happened is. I put a bunch of filler then I sanded it all down, I removed all the filler (unintentionally), then I put the epoxy primer on because that section of the panel is bare metal. The car is parked outside so I needed to protect it in the meantime incase it rains.
 -
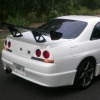
 It’s definitely an import, the Aussie ones have reflectors in the rear bar, it’s also a turbo which none of the Aussie one were. I remember back in the day I want a twin turbo z32 so bad and then I saw a 32 gtr and that was the end of that lol
-


Recommended Posts
Create an account or sign in to comment
You need to be a member in order to leave a comment
Create an account
Sign up for a new account in our community. It's easy!
Register a new accountSign in
Already have an account? Sign in here.
Sign In Now