

Announcements
-
Similar Content
-
-
Latest Posts
-
-
 It was a great, but typical track day, and some VB was ingested at the night time debrief 🤪
 -
 And so, to round this out, I couldn't be happier to confirm @MBS206 has decided to buy the car. He drove down from sunny QLD with a trailer last week and it is off to its new home today. I'll let Matt confirm on next steps but I understand broadly that the plan is to leave it pretty much as is, and just get some quality wheel time with a nicely balanced car that is pretty much track ready. There are a few a jobs still to be done first but nothing too major and I think its a very smart buy Dinner last night at the Paragon with a round of VBs (mostly) for Neil
 -
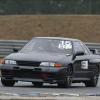
Well, 50 pages and the end of a chapter for this car. We took it out for a shakedown at Wakie yesterday, and everything went well. There were a couple of niggles: - Oil cooler fitting leak - tightened, cleaned, stopped leaking - Radiator cap overflow fitting was leaking....Mark called it, the overflow fitting was threaded in and not tight....tightened, tested and held pressure - Small oil leak at the rear of the block, probably the turbo oil feed - too hot to get at it comfortably but probably just needs to be nipped up - leak at the driver's side rear brake line where it meets the hardline. Fitting wasn't loose, so Matt backed it off and back on, no further leaks - there's also a leak somewhere on the top of the fuel tank, maybe that cross over fuel line - that was has been left to fix when its on a hoist Otherwise than those niggles the car went great, turned great and stopped great so it was a very successful day out. I'm always really nervous when a car first hits the track after a long break, especially with a brand new engine as well but it was great. VID-20251011-WA0007.mp4 Big thanks to @The Bogan who dropped by and helped out, @MBS206 and my nephew Lachlan the apprentice. Neil's wife Mel also surprised the hell out of all of us by dropping by; she's up in Tamworth these days but was travelling to Melbourne so had plausible deniability for turning up at the garage, it was great to see her but also obviously a bit sad all round.
-
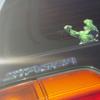
 Skyline R33 Series 2 sedan tail lights in excellent condition. These are becoming harder to find, especially in this state. BOTH SETS ARE IN FANTASTIC CONDITION (REFER TO PHOTOS) ✅ No broken covers or cracks ✅ Lenses are in flawless condition ✅ All rear mounting lugs intact ✅ Comes complete as pictured ✅ Perfect for restoration, replacement, or upgrade These lights are ready to go, no surprises just quality OEM parts. These are definitely one of the better sets we have seen in a while. With minimal wear and tear they will come as you see. Bear in mind they are not brand new they are almost 30 years old now. To find them in this condition isn’t easy they can only be obtained on the second hand market. Australia Wide Postage Available At Buyers Expense. Silver Set:$850 Grey Set:$850 PM Me for purchase or any other questions IMG_2166.dng IMG_2165.dng IMG_2172.dng IMG_2173.dng IMG_2174.dng IMG_2179.dng IMG_2180.dng IMG_2260.dng IMG_2258.dng IMG_2259.dng IMG_2261.dng IMG_2266.dng IMG_2273.dng IMG_2274.dng IMG_2276.dng
-


Recommended Posts
Create an account or sign in to comment
You need to be a member in order to leave a comment
Create an account
Sign up for a new account in our community. It's easy!
Register a new accountSign in
Already have an account? Sign in here.
Sign In Now