

Announcements
-
Similar Content
-
-
Latest Posts
-

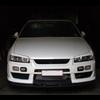
By BaronOBeefdip · Posted
Back again. I returned to Japan in Jul/Aug to spend time with the car on my birthday and remind myself what all the sacrifice and compromise is for. It happened to line up with the monthly morning meet in Okutama, which I have been wanting to go to for a long time. It's a unique event at a unique spot with really rare, interesting, and quirky cars. It's where all the oldheads and OGs gather. The nighttime scene at DKF certainly has its place and should be experienced if you're into cars, but there's too much bad attention and negativity around it now. IMO the better time is Sunday morning at DKF or Okutama; it's more chill and relaxed. I'm glad I was finally able to go, but not sure it's worth the drive from all the way from Nagoya immediately the day before, unless I was already staying in Tokyo for the days right before the meet, because you have to wake up quite early to make it in time. Funnily enough though I didn't drive the car all that much this trip because it was just too damn hot. While there were zero issues and running temps were nominal and the A/C was strong, RBs already run crazy hot as it is. Sure, it took it all like a champ but something about driving these cars in the ridiculous heat/humidity bothers me and makes me feel like I'm asking too much of it. I'm just me being weird and treating the car like a living thing with feelings; I'm mechanically sympathetic to a fault. Instead I was mainly driving something else around - a KX4(silver) 2001 X-Trail GT, that I acquired in May. There's a few different flavors to choose from with Xs, but visually it's the Nissan version of the Honda CR-V. Mechanically it's a whole different story as this, being the top-trim GT, has an SR20VET mated to a four-speed auto and full-time AWD! It was a very affordable buy in exceptional condition inside and out, with very low mileage...only 48k kms. Most likely it was owned by an older person who kept it garaged and well-maintained, so I'm really happy with how it all worked out. It literally needs zero attention at the moment, albeit except for some minor visual touch-ups. I wanted something quirky, interesting, and practical and for sure it handily delivers on all three of those aspects. I was immediately able to utilize the cargo and passenger capacity to its full extent. It's a lot of fun to drive and is quite punchy through 1st and 2nd. It's very unassuming -in the twisty bits it's a lot more composed than one would think at a glance- and it'll be even better once I get better tires on it(yes, it's an SUV but still a little boat-y for my liking). So...now I have two golden-era Nissans in silver. One sports car and one that does everything else; the perfect two-car solution I think👍 The rest of the trip...I was able to turn my stressed brain off and enjoy it, although I didn't quite get to do as much as I thought. I did some interesting things, met some interesting people, and happened into some interesting situations however, that's all for another post though only if people really want to know. Project-wise, I went back to Mine's again to discuss more plans and am hoping to wrap that up real soon; keep watching this space if that interests you. Additionally, while working in the tormenting sweatbox that is the warehouse, I was able to organize most of the myriad of parts that my friend is storing for me along with the cars, and the 34 has a nice little spot carved out for it: And since it can get so stupid hot in there, that made it all the more easy -after I was standing there looking at the car and said 'f**k it'- to finally remove all the damn gauges that have mostly been an eyesore all this time. Huzzah. The heat basically makes the adhesive backing on the gauge mounts more pliable to work with, so it was far less stressful getting this done. I didn't fully clean it up or chase the wiring though; that will happen once I have the car in closer possession. Another major reason to remove all that stuff is to give people less reasons to get in my car and steal s**t while it's being exported/imported when/if the time comes, which leads us to my next point... ...and that is even though it's time in Japan is technically almost up since it's a November car and the X would be coming in March, I'm still not entirely sure where my life and career is headed; I don't really know what the future looks like and where I'm going to end up. I feel there's a great deal of uncertainty with me and as a result of that, it feels like I'm at a crossroads moreso now than any point in my life thus far and there are some choices I need to make. Yes, I've had some years to consider things and prepare myself, however too much has happened in that time to maintain confidence and everything feels so up in the air; tenuous one might say. Simply put, there's just too much nonsense going on right now from multiple vectors. Admittedly, I'm struggling to stay in the game and keep my eyes on the prize. So much so in fact, that very recently I came the closest I ever have before to calling it quits outright; selling everything and moving on and not looking back. The astute among you will pick up on key subtext within this paragraph. In the meantime I've still managed to slowly acquire some final bits for the car, but it feels nice knowing there's not much left to get and I'm almost across that finish line; I have almost everything I'll ever want for my interpretation and expression on what it is I think an R34 should be. 'til later. -

-
 Also playing with fire if they start to flow more air down low than what the stock twins can. It's not even up top you need to worry, it can be at 3000rpm and part throttle and it's getting way more flow than it should.
 -

-

By joshuaho96 · Posted
You still want a proper tune on the stock ECU though. Stock tune + stock ECU with GT-SS/-9s is probably playing with fire if you're running more than stock airflow/power.
-


Recommended Posts
Create an account or sign in to comment
You need to be a member in order to leave a comment
Create an account
Sign up for a new account in our community. It's easy!
Register a new accountSign in
Already have an account? Sign in here.
Sign In Now